How-To//12 min read
How to Prove an AI-Built Website Is Better: Testing, KPIs and Systems
Being built with AI does not make a website better. Measurable results do: faster pages, clearer journeys, more qualified leads, fewer barriers and lower running costs. This guide covers the twelve areas worth testing, the KPIs that prove the new site beats the old one, and the systems that keep measuring after launch.

By Jason Gordon
Founder & CEO, Specloop
Why "built with AI" is not the result
AI has made websites faster and cheaper to build. That is useful, but it is not what a business pays for. Customers care whether a page loads quickly, whether they can find what they came for and whether getting in touch is easy. Owners care whether the site brings in more qualified work for less money than the one it replaced.
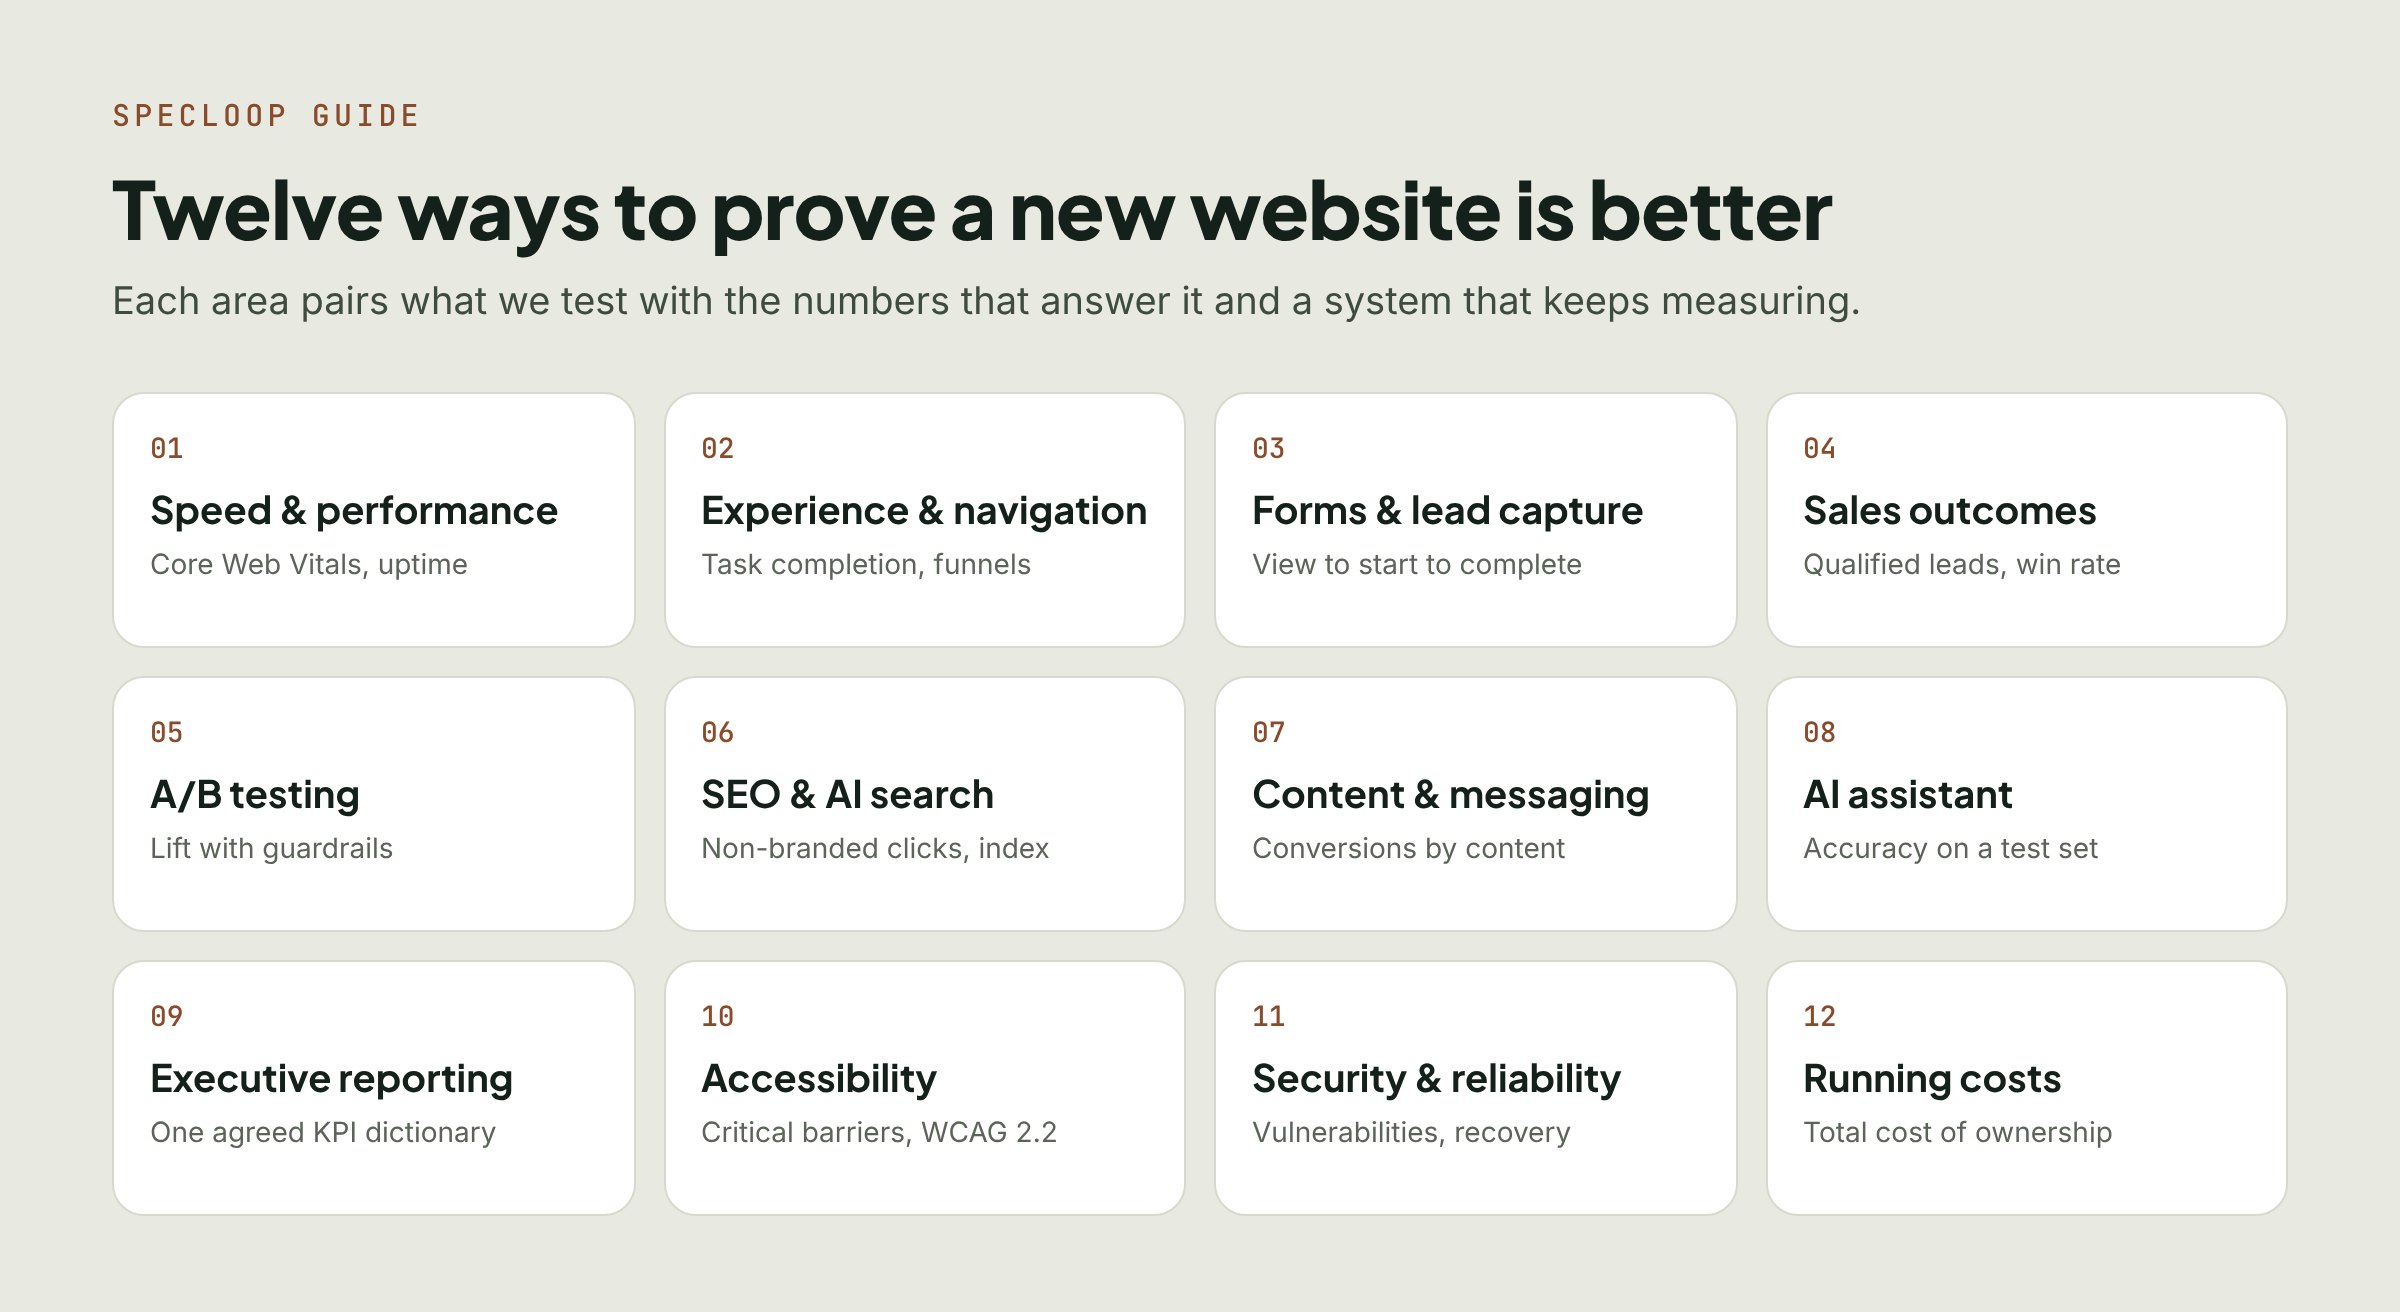
This guide is the menu we work from: twelve areas, each with what we test, what we measure and what we can build to keep measuring. Very few sites need all of it. The last two sections show how to choose a focused starting point.
The twelve areas at a glance
If you read nothing else, this table is the guide: one headline number per area, and the system that keeps it honest.
| Area | Headline KPI | What keeps measuring |
|---|---|---|
| Speed | Core Web Vitals pass rate | Uptime and speed alerts |
| Experience | Task completion rate | Funnel dashboards |
| Forms | Visitor-to-lead conversion | Field-level form analytics |
| Sales | Qualified leads, win rate | Website-to-CRM reporting |
| Experiments | Lift with guardrails | Feature flags, decision log |
| SEO and AI search | Non-branded organic clicks | Search Console, audits |
| Content | Conversions by content | Content dashboard |
| AI assistant | Accuracy on a test set | Evaluation suite |
| Reporting | Data freshness, coverage | Executive dashboard |
| Accessibility | Critical barriers | Checks on every release |
| Security | Open vulnerabilities | Scanning and audit logs |
| Running costs | Total cost of ownership | Cost and usage dashboard |
1. Website speed and technical performance
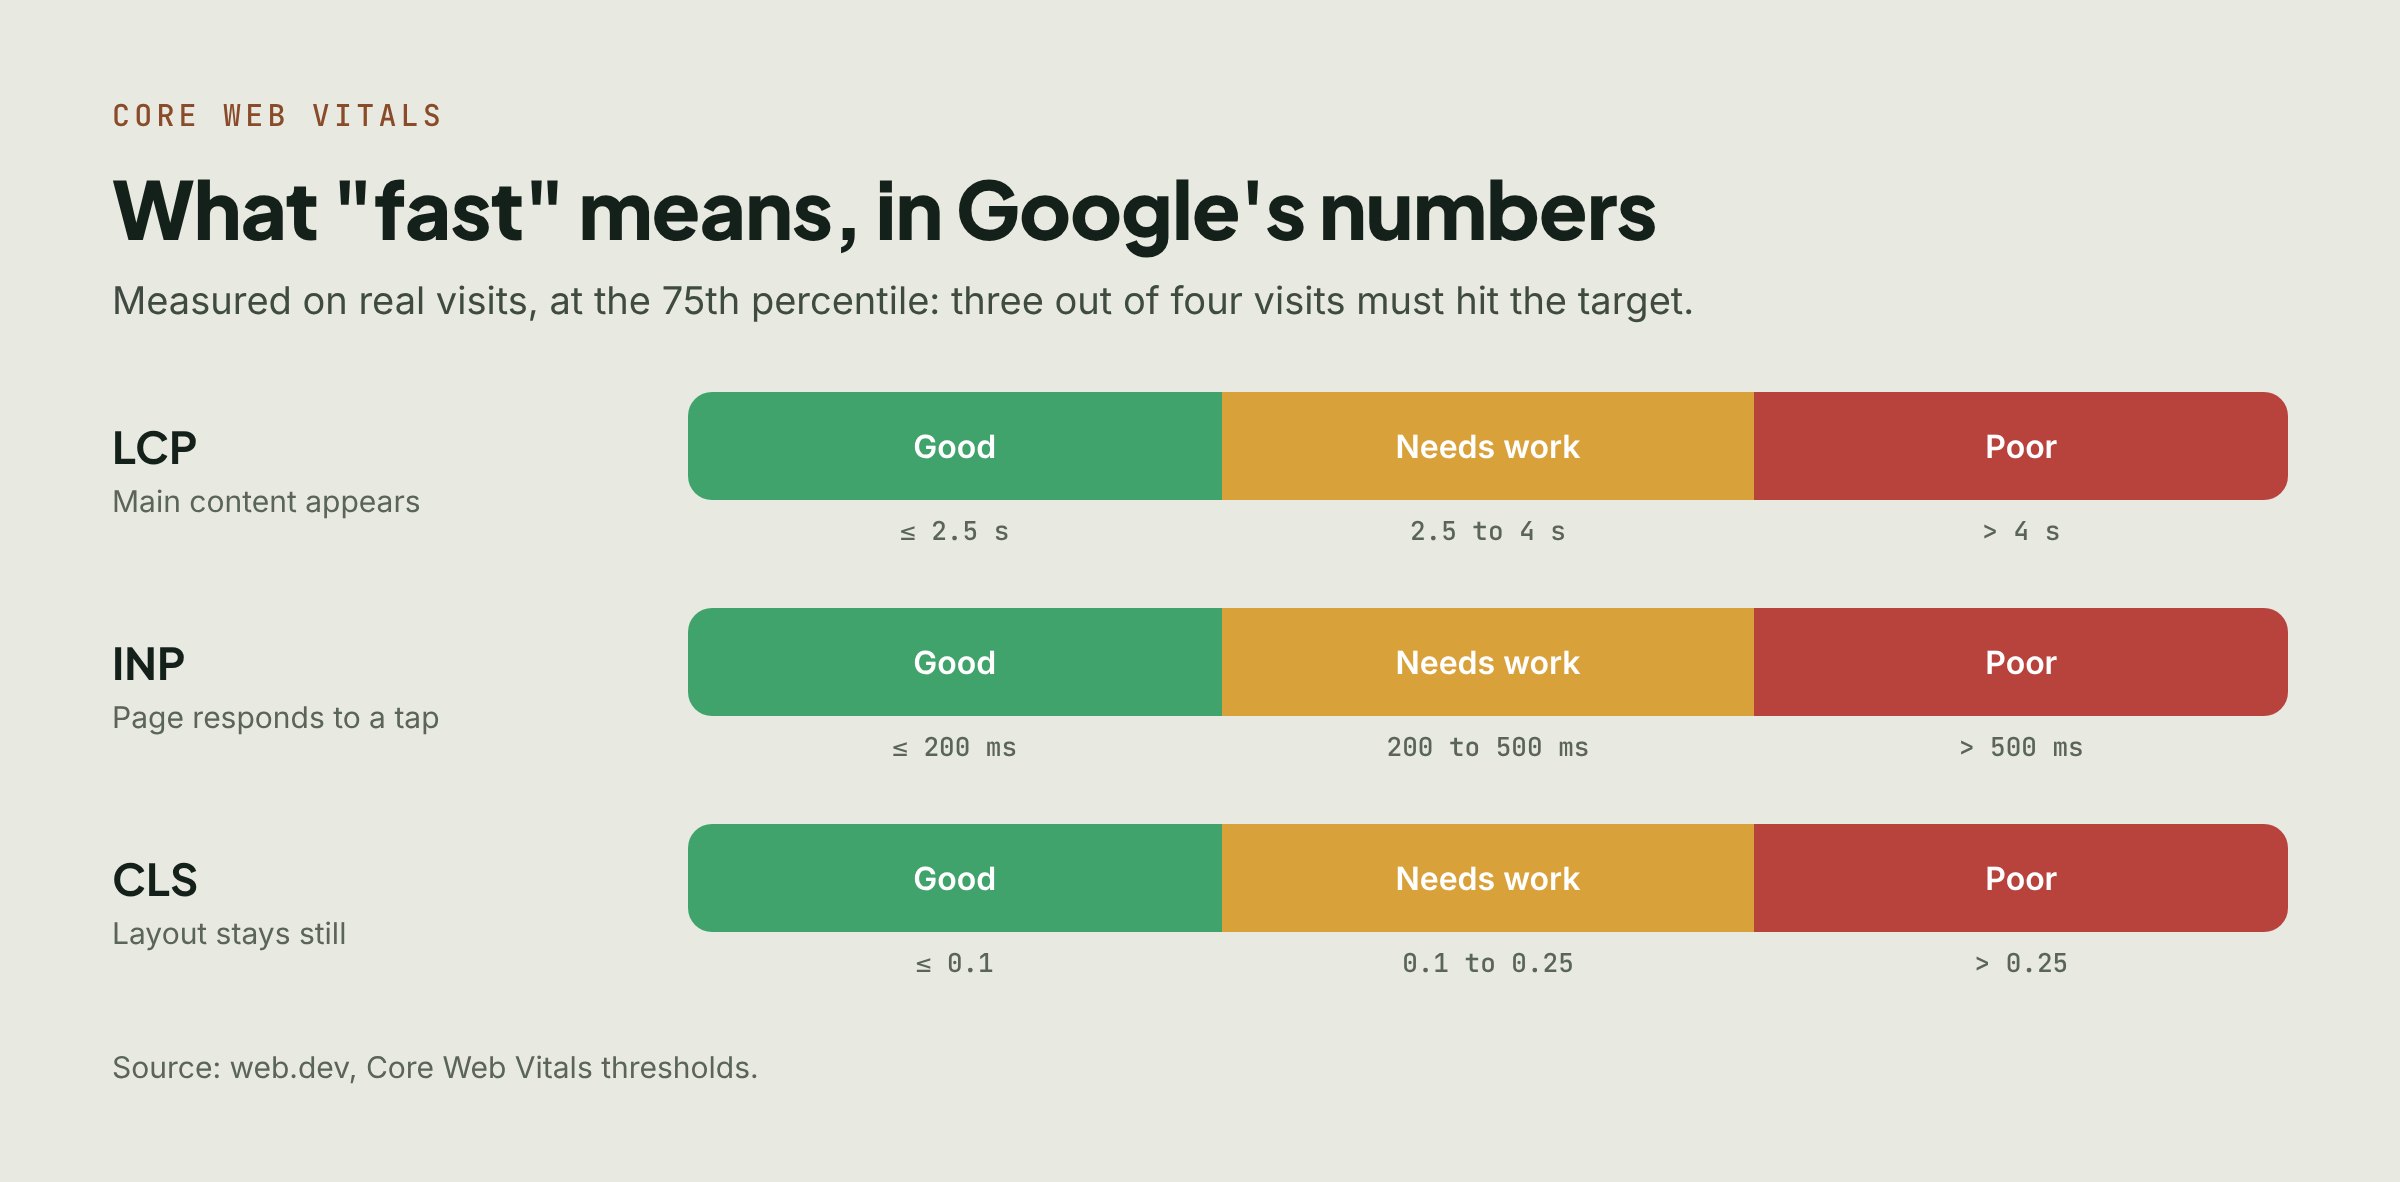
Speed is where a rebuild usually shows its first clear win, and where it is easiest to fool yourself: a homepage tested once on office Wi-Fi tells you very little.
| What we test | What we measure | What we can build |
|---|---|---|
| New site vs the old one, page for page | Largest Contentful Paint (LCP) | Performance dashboard |
| Mobile vs desktop | Interaction to Next Paint (INP) | Speed checks with regression alerts |
| Browsers, locations, connection speeds | Cumulative Layout Shift (CLS) | Uptime monitoring |
| Image formats, compression, lazy loading | Time to First Byte (TTFB) | Error tracking, ranked by impact |
| Caching, delivery, database | Page weight and request count | Scheduled health reports |
| Tags, plugins, embeds, scripts | Core Web Vitals pass rate | |
| Behaviour under traffic | Error rate and uptime | |
| Broken links, failed requests, JS errors |
We already check every live site we look after every five minutes, and show uptime for 24 hours, 7 days and 30 days on the client's dashboard.
2. User experience and navigation
A fast page that sends people to the wrong place is still a failed visit. This area asks whether visitors can do what they came to do.
| What we test | What we measure | What we can build |
|---|---|---|
| Menu structure, labels, hierarchy | Task completion rate | Journey and funnel dashboards |
| Can people find key information | Time to complete a task | Event tracking on key actions |
| Mobile layout, readability, touch targets | Navigation and CTA click-through | On-site feedback and short surveys |
| Calls to action and page length | Search success and no-results rate | Heatmaps, consent-aware replay |
| Internal search | Funnel abandonment | Search reporting |
| Landing pages vs what brought people | Engagement rate and scroll depth | |
| Journeys and points of confusion | Satisfaction scores |
3. Forms and lead capture
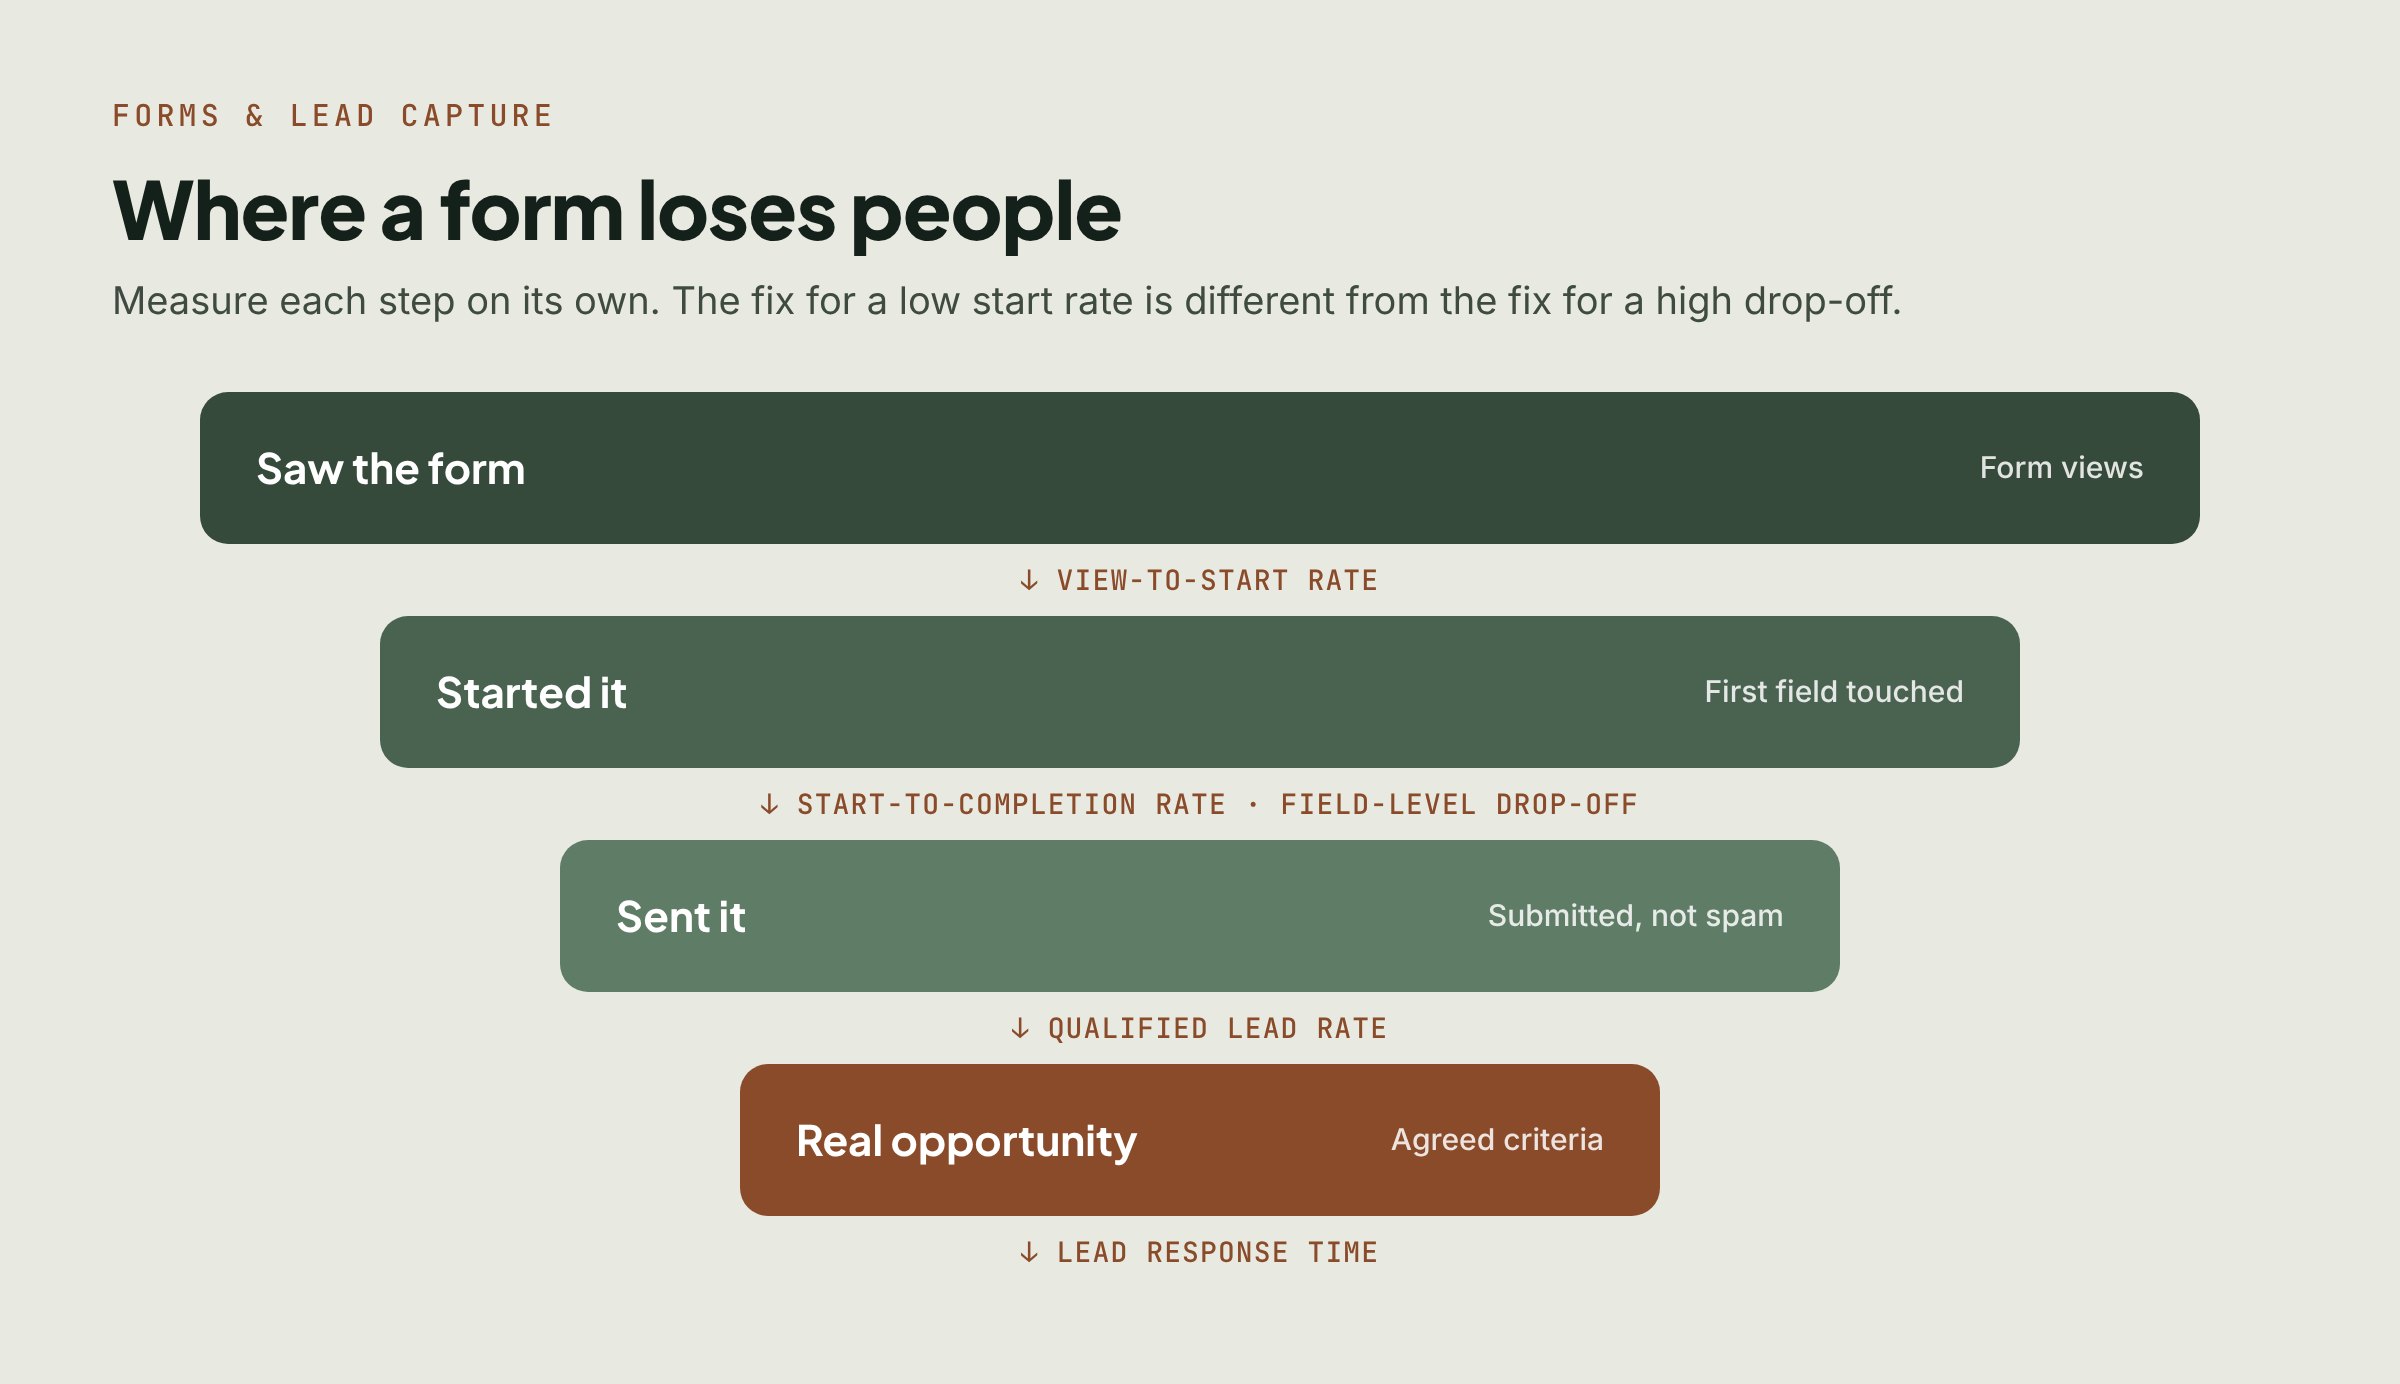
For most service businesses the form is the website's job. Small changes here often move results more than a full redesign.
| What we test | What we measure | What we can build |
|---|---|---|
| Short vs long forms | View-to-start rate | Field-level form analytics |
| Single-step vs multi-step | Start-to-completion rate | Lead routing and notifications |
| Field order, labels, validation | Visitor-to-lead conversion | CRM sync with deduplication |
| Placement and button wording | Field-level drop-off and errors | Spam filtering |
| Booking tool vs contact form | Qualified lead rate | Booking workflows |
| Mobile use and autofill | Spam and duplicate rate | Follow-up automation |
| Confirmation and follow-up | Cost per (qualified) lead | Lead scoring on agreed criteria |
| Spam protection and delivery | Lead response time |
4. Sales and business outcomes
This is where a website stops being a marketing project and becomes a business one. The question is not "did traffic go up?" but "did the site produce more of the work we want?"
| What we test | What we measure | What we can build |
|---|---|---|
| Which pages and channels bring qualified work | Marketing- and sales-qualified leads | Website-to-CRM reporting |
| Demo, consultation, quote and booking flows | Lead-to-meeting conversion | Closed-loop conversion tracking |
| How offers and pricing are shown | Meeting attendance | Pipeline and revenue dashboards |
| Sales handoff and follow-up timing | Opportunities and win rate | Channel attribution |
| Sales cycle length | Call tracking | |
| Revenue per lead or visitor | ||
| Acquisition cost and return on ad spend |
5. A/B testing and experimentation
Once the basics are measured, experiments turn opinions about the site into evidence.
| What we test | What we measure | What we can build |
|---|---|---|
| Headlines and value propositions | Conversion rate by variation | Experiments and feature flags |
| CTA wording, placement, design | Absolute and relative lift | Controlled traffic split |
| Layout and content order | Impact on qualified leads or revenue | Experiment dashboards and decision log |
| Testimonials and trust signals | Sample size and uncertainty | Rollback controls |
| Images, video, demos | Guardrails: speed, errors, lead quality | A ranked testing backlog |
| Forms, offers, landing pages | ||
| Privacy-safe personalisation |
6. SEO and organic visibility
A rebuild is the moment a site is most likely to lose search traffic, and the moment it has the best chance to fix long-standing problems.
| What we test | What we measure | What we can build |
|---|---|---|
| Crawling, indexing, sitemaps, canonicals | Organic clicks, impressions, CTR | Search Console reporting |
| Redirects from old addresses | Position trends for relevant queries | Automated SEO audits |
| Titles, descriptions, headings, links | Index coverage and crawl errors | Redirect validation |
| Structured data | Organic landing-page conversions | Content opportunity dashboard |
| Duplicate and broken pages | Non-branded organic traffic | Migration monitoring and alerts |
| Search intent and content gaps | Redirect errors, lost high-value pages | |
| Local SEO where relevant |
7. Content and messaging
Design gets the attention, but words do most of the selling.
| What we test | What we measure | What we can build |
|---|---|---|
| Benefit-led vs feature-led | Conversions by content | Content performance dashboard |
| Short vs detailed | Assisted conversions | Inventory with review reminders |
| Audience-specific pages | FAQ usage | Editorial approval workflow |
| FAQs and objection handling | Helpfulness ratings | AI-assisted drafting, human review |
| Case studies and proof points | Engagement by audience or source | Reusable landing-page templates |
| Clarity, accuracy, freshness | Outdated or unreviewed pages |
8. Live chat and AI assistant performance
If the site includes an AI assistant, test it for usefulness and reliability. A confident wrong answer does more damage than no answer.
| What we test | What we measure | What we can build |
|---|---|---|
| Answers vs approved sources | Accuracy on a defined test set | Approved knowledge base |
| Common and difficult questions | Unsupported-answer rate | AI evaluation suite |
| Saying "I don't know" | Retrieval and citation accuracy | Conversation analytics |
| Citations and retrieval | Verified resolution rate | Human handoff |
| Qualification and booking | Escalation and abandonment | Feedback and correction queue |
| Handoff to a human | Satisfaction and response time | Permission-based data access |
| Prompt injection and data leaks | Cost per conversation | Model, prompt and knowledge versions |
| Missing or conflicting information | Leads and bookings; safety pass rate |
9. Analytics and executive reporting
The other sections each produce numbers. Reporting turns them into answers an owner can act on: is the new site better, where do people drop off, which channels bring qualified leads, what changed after a release, and what to test next.
| What we test | What we measure | What we can build |
|---|---|---|
| Is the new site performing better | The agreed KPIs from each section | Shared reporting data layer |
| Where visitors drop off | Data freshness and completeness | Executive and team dashboards |
| Which channels bring qualified leads | Tracking coverage | GA4, Search Console, CRM, ads, chat |
| Which pages lead to bookings or sales | Integration failures and gaps | Scheduled reports, anomaly alerts |
| What changed after a release | An agreed KPI dictionary | |
| What to test next | Plain-language questions over the data |
10. Accessibility and compatibility
An accessible site works for more people, reads better to search engines and AI assistants, and reduces legal risk.
| What we test | What we measure | What we can build |
|---|---|---|
| Keyboard navigation and focus | Automated issues by severity | Automated checks on every release |
| Screen-reader behaviour | Manual task results | Manual review checklists |
| Headings and semantic markup | Unresolved critical barriers | Compatibility test suites |
| Contrast, resizing, reduced motion | Browser and device pass rate | Regression tracking |
| Form labels and error messages | ||
| Devices, browsers, screen sizes |
11. Security, privacy and reliability
A site that leaks data or goes down at the wrong moment undoes every other gain.
| What we test | What we measure | What we can build |
|---|---|---|
| Logins, permissions, admin access | Open vulnerabilities by severity | Security scanning and alerts |
| Form validation, common vulnerabilities | Patch turnaround time | Role-based access |
| Dependency and plugin risk | Uptime and incident frequency | Audit logs and retention |
| Consent and tracking controls | Recovery time, restore tests | Backup and recovery workflows |
| Backups, restore, rollback | Consent configuration tests | Consent management |
| Integration failures | Unauthorised-access test failures | Incident response plan |
| AI access boundaries |
12. Operational efficiency and cost savings
Some of the clearest returns never show up in analytics. They show up in invoices and in hours.
| What we test | What we measure | What we can build |
|---|---|---|
| Replacing plugins with simpler builds | Monthly software, hosting, AI costs | Software and plugin inventory |
| Automating reports and admin | Total cost of ownership | Cost and usage dashboard |
| Publishing and approval workflows | Staff time per task | Workflow automation |
| Time to launch pages and tests | Time to publish or launch a test | Reusable page components |
| Maintenance effort before and after | Maintenance hours, support volume | Approval and publishing tools |
| Cost per lead, chat or workflow run | Maintenance reporting |
How we prove the new site is better
Measurement only proves something if it is set up before launch and applied the same way afterwards.
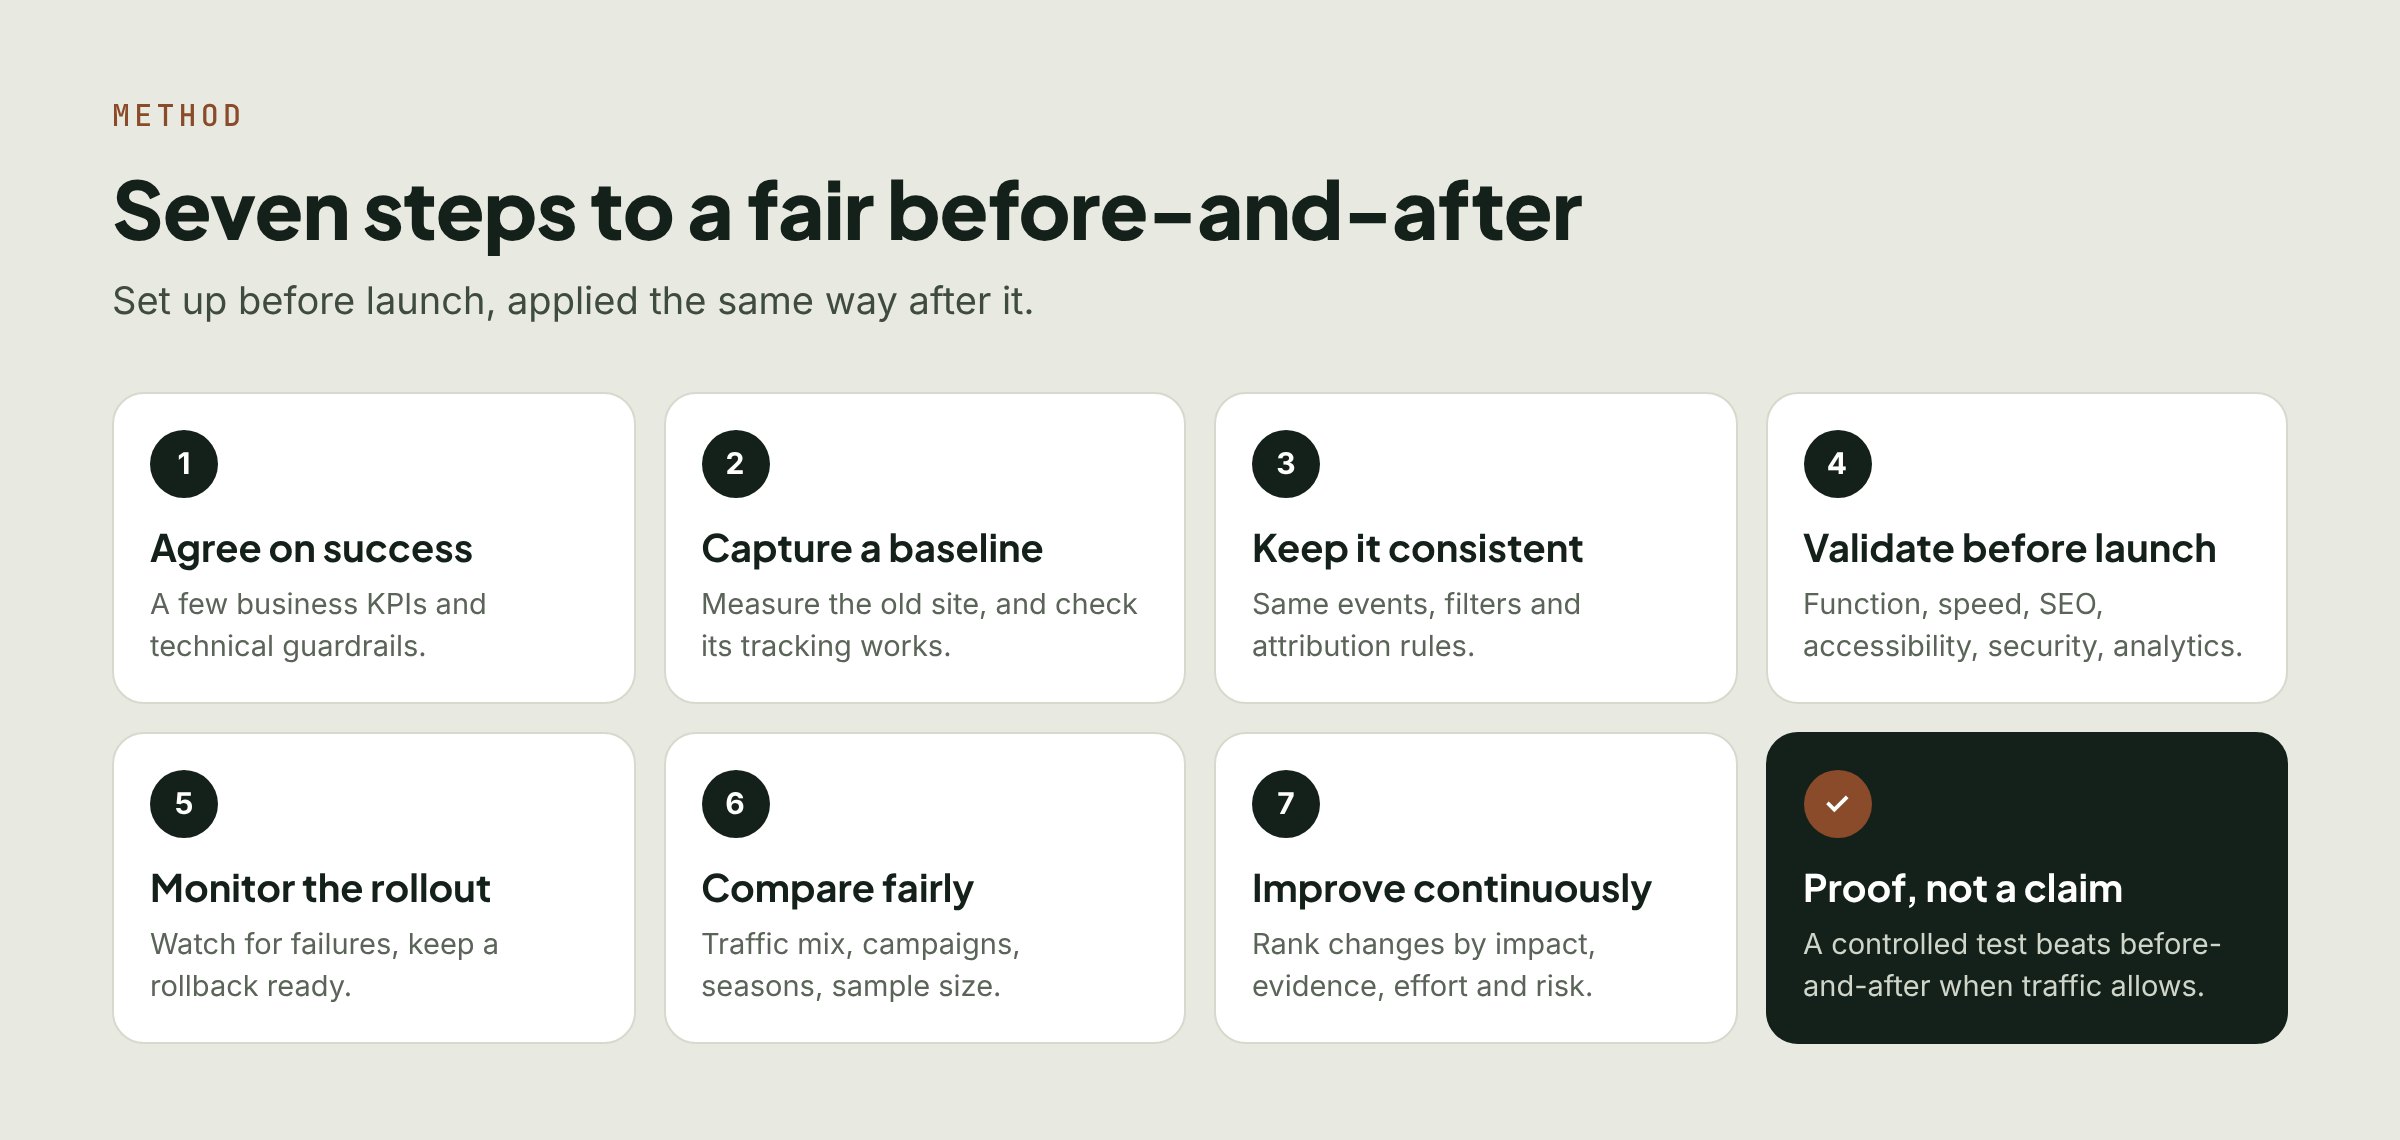
| Step | What it means in practice |
|---|---|
| 1. Agree on success | A small set of business KPIs and technical guardrails. Five well-chosen numbers beat fifty. |
| 2. Capture a baseline | Measure the existing site, and check its tracking actually works, before anything changes. |
| 3. Keep measurement consistent | Same event definitions, filters and attribution rules before and after. |
| 4. Validate before launch | Functionality, accessibility, performance, SEO, security and analytics. |
| 5. Monitor the rollout | Watch for failures and keep a rollback plan ready. |
| 6. Compare fairly | Account for traffic mix, campaigns, seasonality and sample size. |
| 7. Improve continuously | Rank the next changes by impact, evidence, effort and risk. |
A suggested scope structure
Splitting the work into workstreams keeps the website contract clear, and lets each part be priced and judged on its own.
| Workstream | Suggested scope |
|---|---|
| Core website | Agreed pages, responsive layouts, forms, baseline SEO, accessibility work and essential tracking |
| Launch validation | Functional QA, performance checks, redirect checks, analytics verification and baseline reporting |
| Optimisation package | Funnels, experiments, usability testing and recurring improvement reports |
| Executive dashboard | Cross-platform data, KPI reporting, alerts and optional natural-language analysis |
| AI systems | Knowledge assistant, qualification tools, workflow automation, evaluations and monitoring |
| Ongoing support | Maintenance, reporting, testing, content updates and a defined development allowance |
For each workstream, write down the deliverables, acceptance criteria, integrations, third-party fees, recurring costs, support responsibilities and exclusions.
Where to start
For most businesses the right first step is a focused proof-of-value package:
| Included | Why it is there |
|---|---|
| Baseline comparison of the old and new sites | Without it, "better" is an opinion |
| Speed, reliability, accessibility and SEO checks | The guardrails every launch needs |
| End-to-end form and conversion tracking | Shows whether the site does its job |
| Lead-quality reporting connected to the CRM | Counts qualified work, not just form fills |
| One executive dashboard | One place to read the result |
| A prioritised experiment backlog | Knows what to try next, and why |
| AI chat evaluation and monitoring | Only if the site includes chat |
| A regular review with clear recommendations | Turns numbers into decisions |
This gives clear evidence of value without turning a website contract into an open-ended software project. Once the first results are in, the next investment chooses itself.
If you want help deciding which of these matter for your site, start a project and we will begin with the baseline.
Sources & references
Frequently asked
Questions people ask about this
- Not by itself. AI makes building faster and cheaper, but a site proves it is better through measured results against the old site: speed, usability, conversions, accessibility, running costs and business outcomes.
About the author
Jason Gordon
Founder & CEO, Specloop
Jason Gordon is the founder of Specloop, a spec-driven AI development studio that builds production-grade business applications from a complete specification, in weeks, at flat rate, with 100% code ownership. He also builds GeoTest, a free tool that scores how visible a site is to AI search engines. He writes about AI search, spec-driven development, and why most AI builds never reach production.
Follow Jason on LinkedIn →Keep reading
Related posts
How-To
Trailing Slashes: The URL Decision Nobody Makes
/pricing and /pricing/ are two different URLs to your server, to Google and to your analytics. Most sites never pick one. Here is why it costs you, which form to choose, how we set it on Vercel and in custom code, and a curl loop that audits any site in ten minutes.

GEO & AI Search
Google Just Killed the Search Box: What I/O 2026 Means for Every Business With a Website
Five days ago at Google I/O 2026, Google announced the biggest change to Search in 25 years, the search bar is being replaced by AI agents. If your website was built to rank on a results page that no longer exists, you have a problem. Here's what changed, why it matters, and what to do this quarter.

Product Updates
Leads That Open Beside the List, and Go Straight to Qualified
For teams running their client work on Specloop: a lead now opens in a panel that slides in beside the list, converting a lead puts the deal straight into Qualified on the pipeline, and past clients sit in the Directory instead of crowding the Leads page. Here is how to work a lead from first touch to deal.

Product Updates
Activity That Keeps You Posted, Automatically
Your project's Activity feed now fills itself. Every update to your site or app shows up as one plain-English line, every launch comes with a link, and finished change requests, calls and documents appear as they happen. Each Monday you get a one-line summary of the week. Here is where to find it and how to read it.
Next step
Want a spec for your build?
We write the full specification before any code is generated, then ship in 30–60 days at one flat rate. You own every line.